Build advanced charts in Power Apps with QuickChart
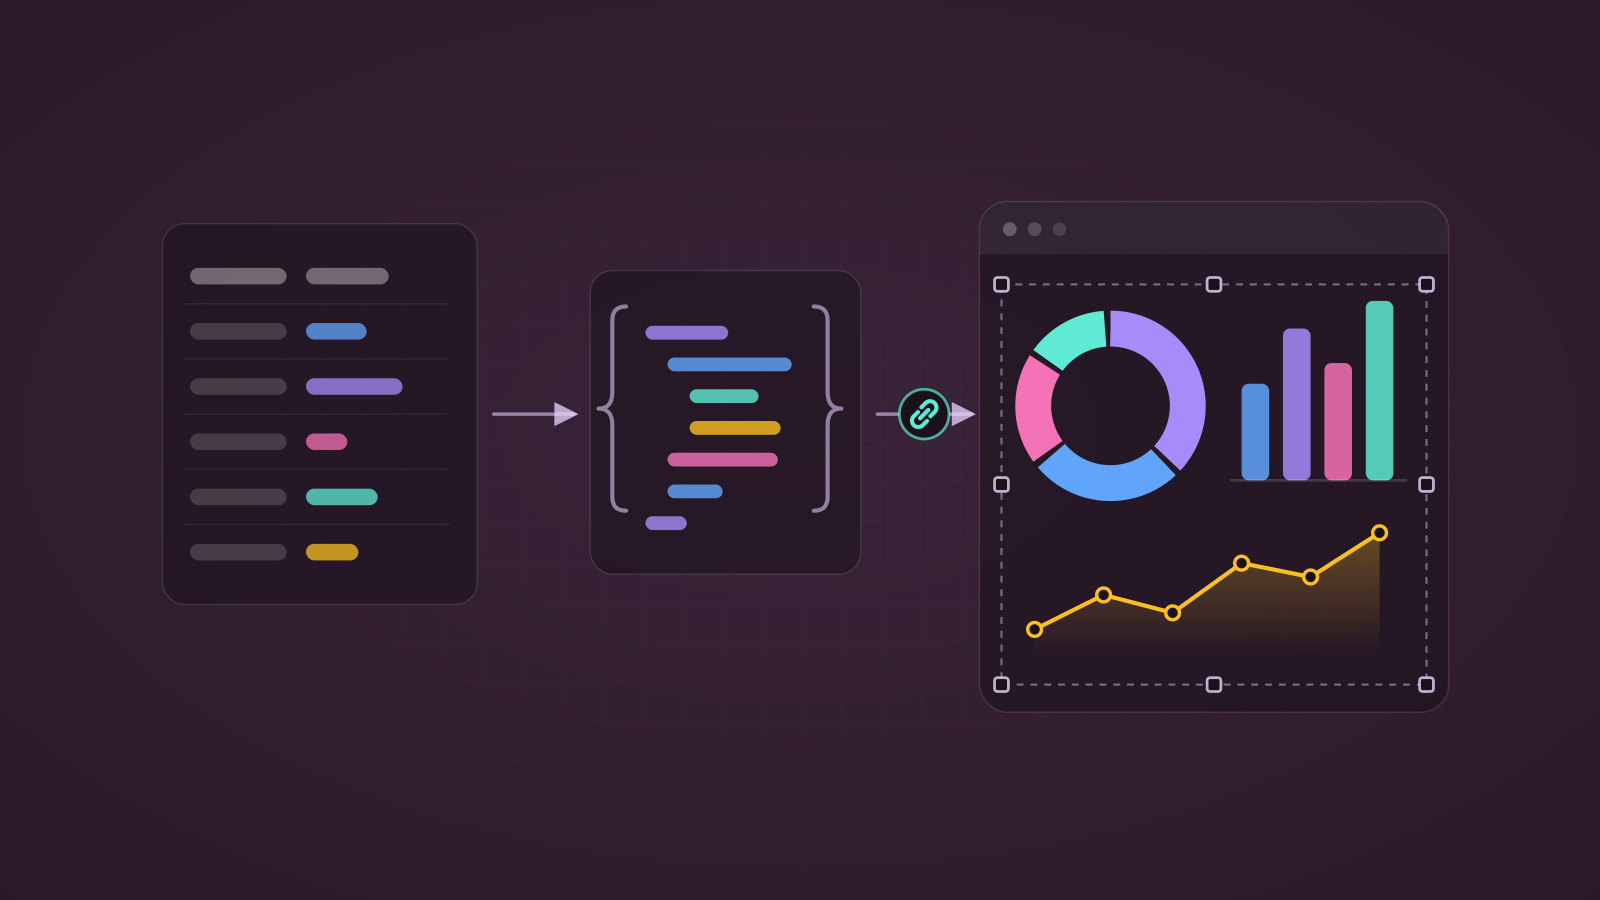
Power Apps' built-in chart controls are limited in type and styling, but QuickChart turns any Chart.js configuration into an image, so a single URL in an Image control gets you labeled bars, doughnuts, radar charts and more.
Before you start
- Check where your data goes. The public
quickchart.ioendpoint receives everything in the URL. For sensitive or regulated data, self-host QuickChart (it's open source and ships as a Docker image) and swap the base URL. - Summarize first. The chart config travels in the URL, so send aggregated values (a few dozen points), not raw rows.
- Replace the placeholder names below —
Tickets(list) andProgram(Choice column) — with your own.
Step 1: Summarize the data
Run this from OnVisible of the screen or from a button's OnSelect.
// One row per Program with a count of tickets
ClearCollect(
    colChartData,
    AddColumns(
        GroupBy(
            AddColumns(Tickets, ProgramName, Program.Value),
            ProgramName,
            ProgramRows
        ),
        TicketCount, CountRows(ProgramRows)
    )
);Note:GroupByisn't delegable, so it only sees the rows Power Apps loaded (2,000 max). For larger lists, load everything first with Retrieve more than 2,000 rows from a SharePoint list in Power Apps and groupcolAllItemsinstead.
Step 2: Render the chart
Insert an Image control, size it to roughly 600 × 350, and set its Image property:
With(
    {
        // 'Label A','Label B',...  (escape apostrophes in names)
        Labels: Concat(colChartData, "'" & Substitute(ProgramName, "'", "\'") & "'", ","),
        // 12,7,30,...
        Values: Concat(colChartData, TicketCount, ",")
    },
    "https://quickchart.io/chart?v=2.9.4&w=600&h=350&bkg=white&c=" &
    EncodeUrl(
        "{
            type: 'bar',
            data: {
                labels: [" & Labels & "],
                datasets: [{
                    label: 'Tickets',
                    backgroundColor: 'rgba(115, 118, 120, 1)',
                    borderWidth: 1,
                    data: [" & Values & "]
                }]
            },
            options: {
                legend: { display: false },
                title: {
                    display: true,
                    text: 'Ticket Volume by Program',
                    fontSize: 20,
                    fontColor: '#000',
                    fontStyle: 'bold'
                },
                scales: {
                    xAxes: [{ gridLines: { display: false } }],
                    yAxes: [{ gridLines: { display: false }, ticks: { beginAtZero: true } }]
                },
                plugins: {
                    datalabels: { display: true, anchor: 'end', align: 'top' }
                }
            }
        }"
    )
)
How it works
Withbuilds the label and value lists once, so the config stays readable.Concat(..., ",")joins values with a separator, with no trailing comma to clean up.EncodeUrlmakes spaces,#,&and line breaks URL-safe. Without it, a program name like "R&D" breaks the chart.v=2.9.4pins Chart.js 2, which matches thexAxes/yAxessyntax. Thedatalabelsplugin is built into QuickChart.- The Image control refreshes whenever
colChartDatachanges, so re-running Step 1 updates the chart.
Change the chart type
Swap type: 'bar' for any of these. Everything else stays the same.
| Type | Best for |
|---|---|
horizontalBar | Long category names |
line | Trends over time |
pie / doughnut | Share of a total (keep it to 6 slices or fewer) |
radar | Comparing several metrics per item |
polarArea | Magnitude by category |
For pie and doughnut charts, pass one color per slice and drop the scales block:
backgroundColor: ['#4E79A7', '#F28E2B', '#E15759', '#76B7B2', '#59A14F', '#EDC948']When should I use QuickChart?
- Use the built-in chart controls for simple charts where you need click events on chart items.
- Use QuickChart when you need data labels, custom styling, or chart types Power Apps doesn't offer. The result is a static image, so it can't be clicked by chart item.
Tip: To debug a chart, set a Label'sTextto the same formula, copy the URL into a browser, and read QuickChart's error message. For sharper output on high-resolution screens, add&devicePixelRatio=2to the URL.